
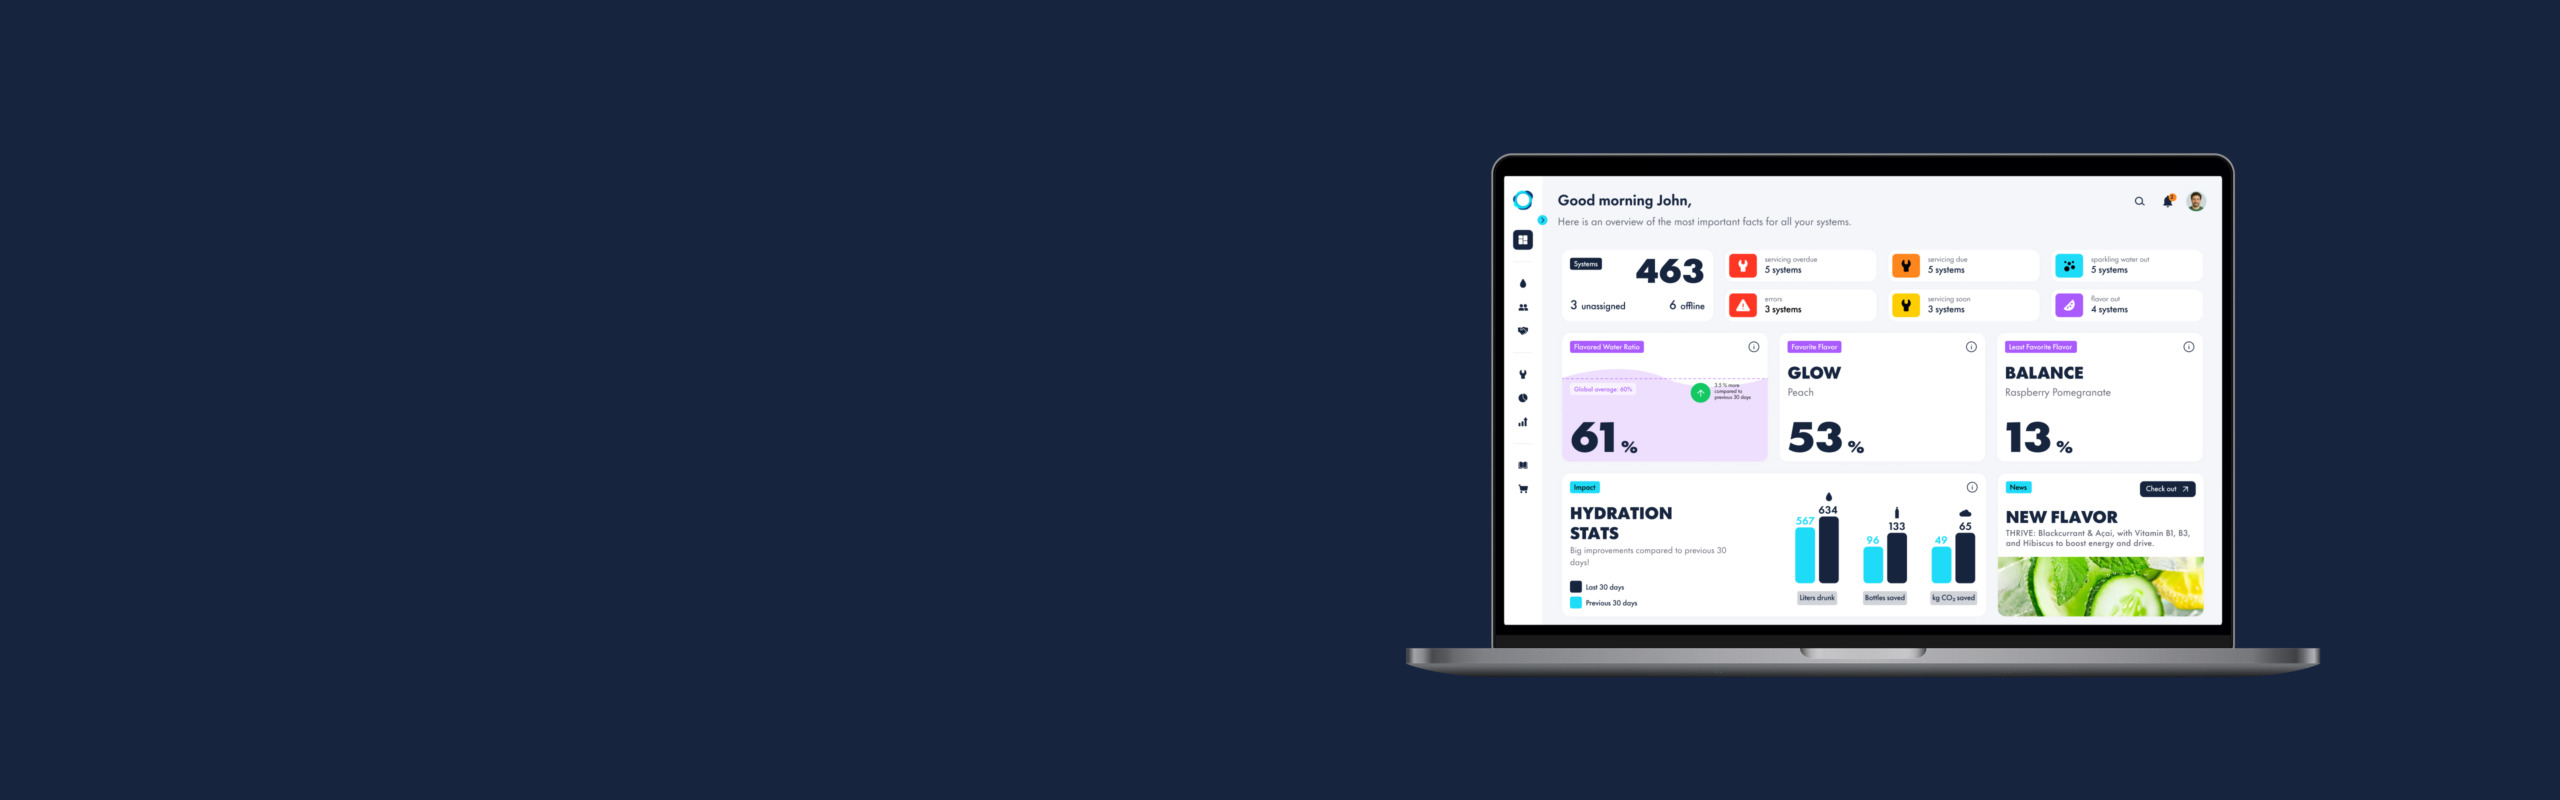
AURA - Transforming fleet management from monitoring to decision support
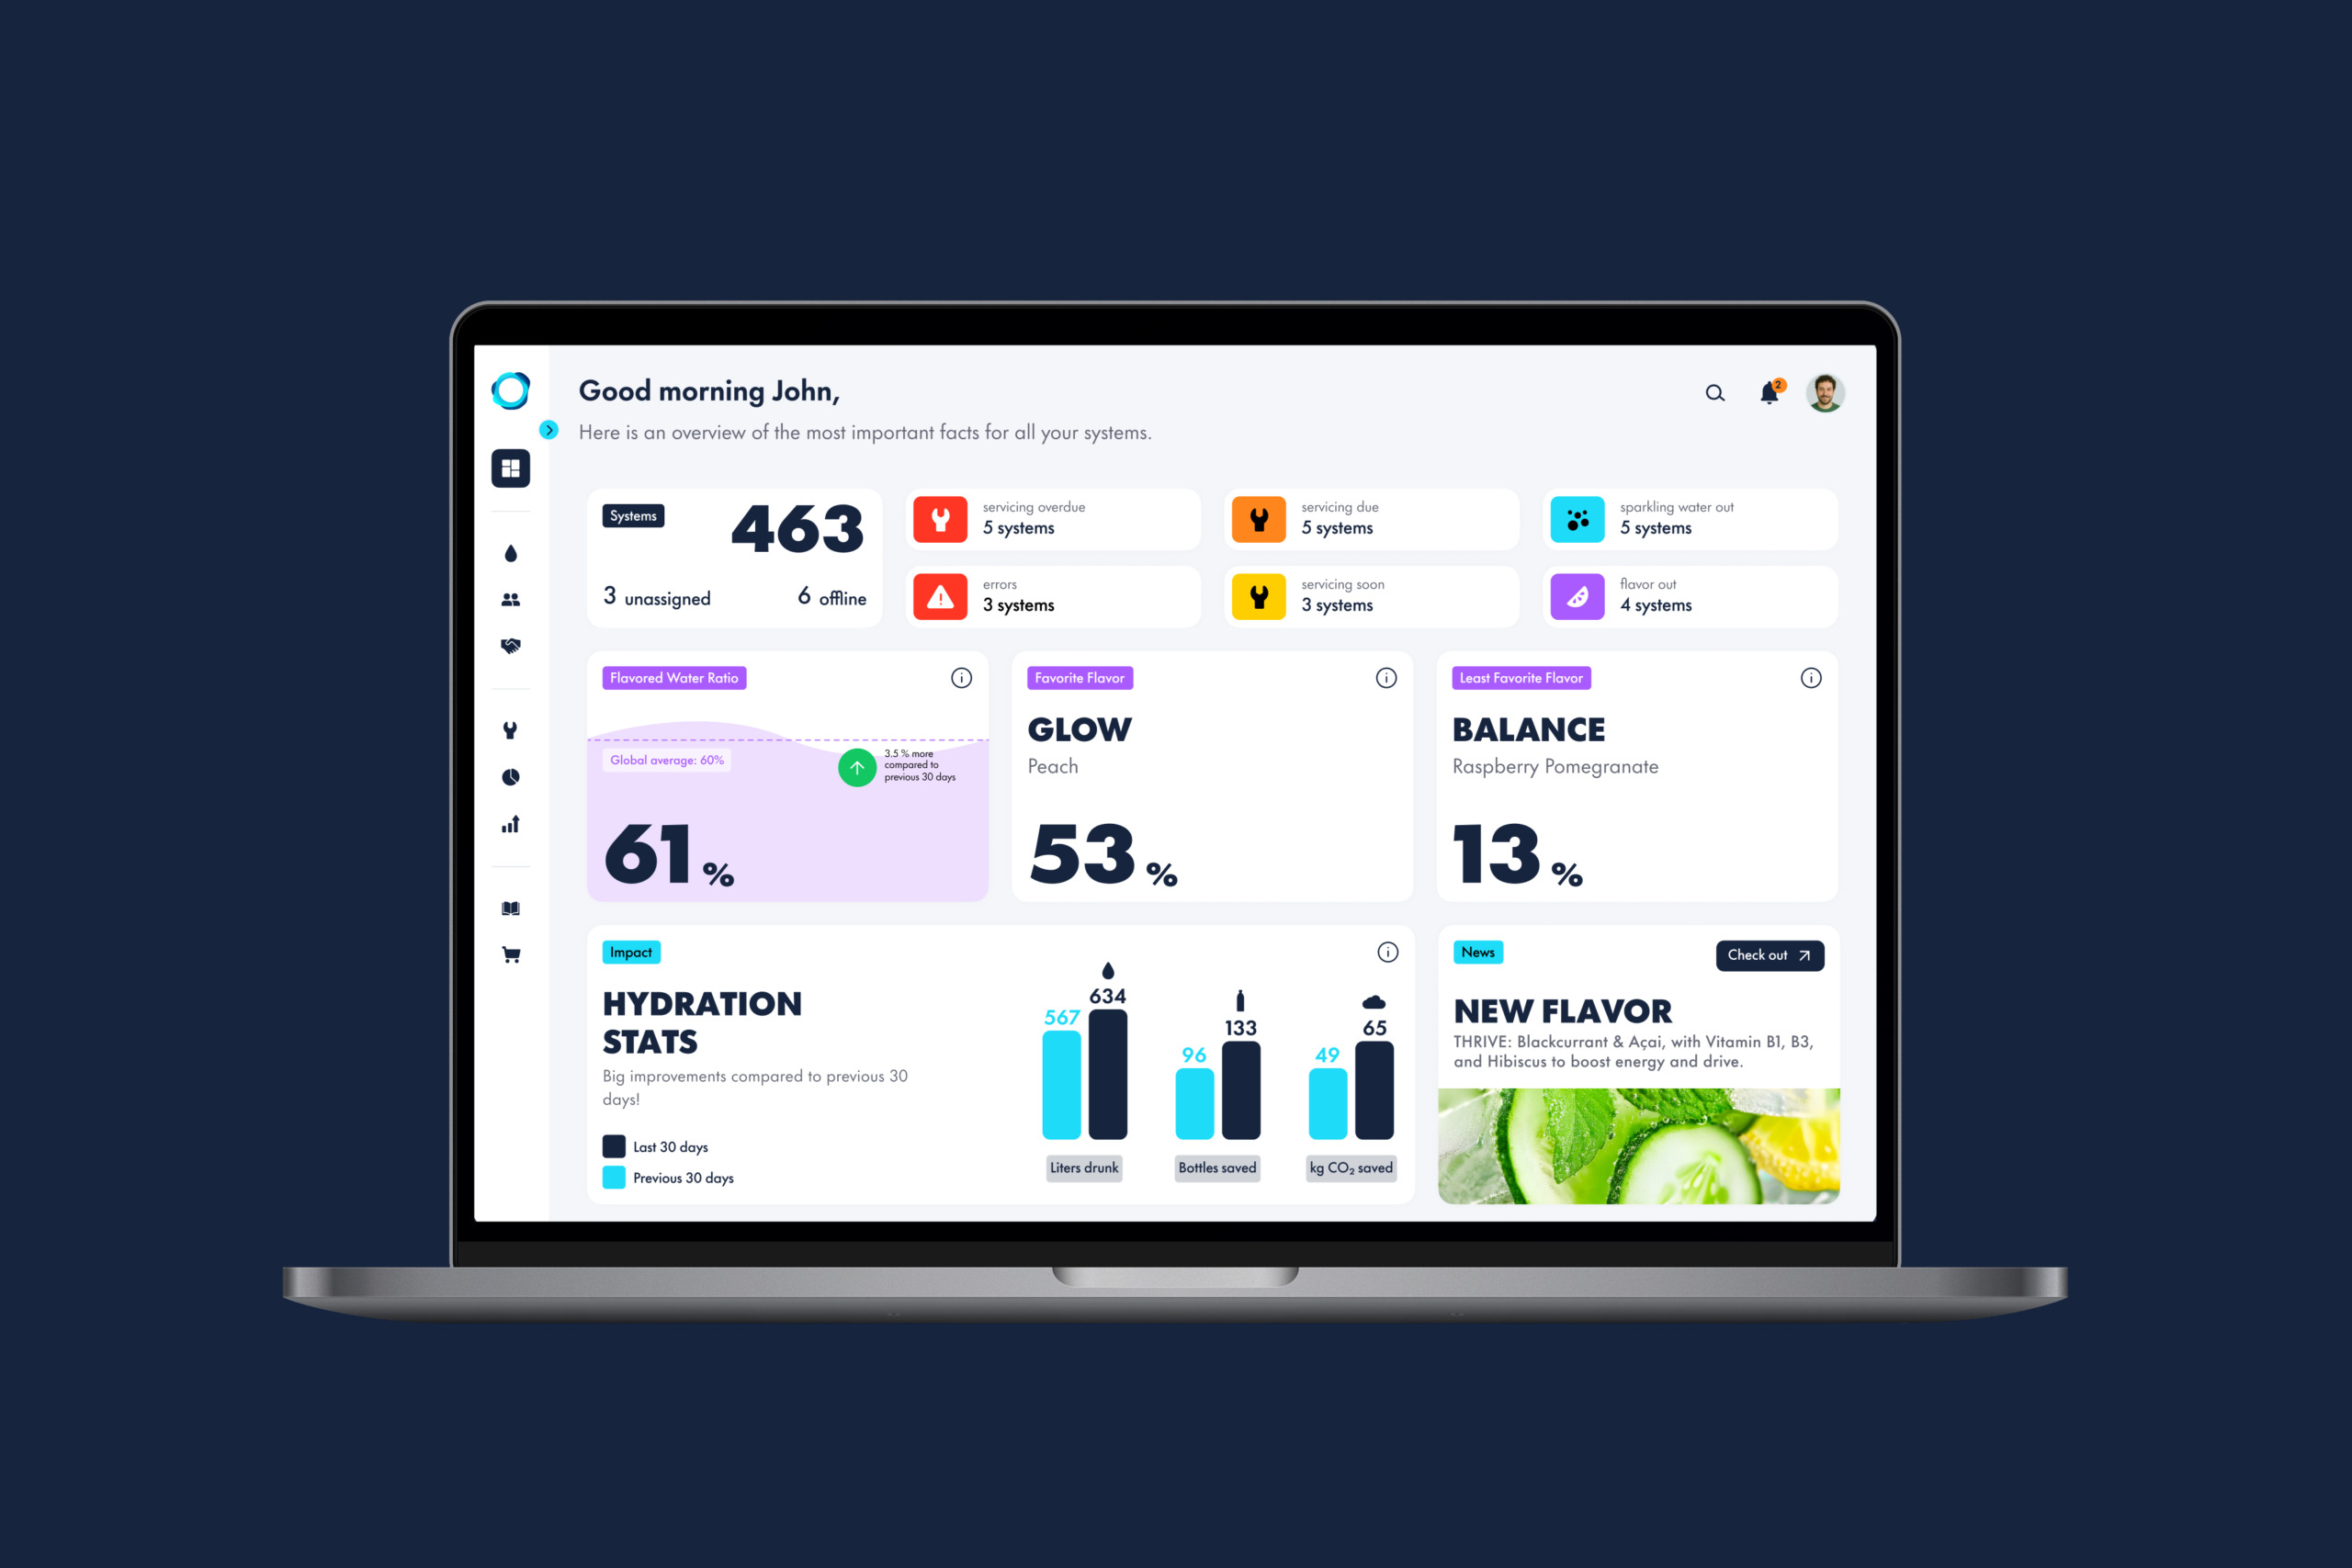
AURA is Aquablu’s fleet management platform, helping internal teams, partners, and clients monitor connected water systems, manage servicing, and gain business insights from usage data.
As the lead product designer on AURA, I partnered closely with Product and Engineering to redesign Aquablu’s fleet management platform into a scalable product that supports operations, partners, and clients. My role spanned digital strategy, UX research, workshop facilitation, UX and UI design, and supporting implementation to ensure the product was delivered with the intended quality.
The product is actively evolving through continuous iterations informed by user feedback and business priorities.
Contribution
Digital Strategy, UX Research, Workshop Facilitation, UX Design, UI Design
Year
2025 – present
Company
Aquablu
AURA - Transforming fleet management from monitoring to decision support
AURA is Aquablu’s fleet management platform, helping internal teams, partners, and clients monitor connected water systems, manage servicing, and gain business insights from usage data.
As the lead product designer on AURA, I partnered closely with Product and Engineering to redesign Aquablu’s fleet management platform into a scalable product that supports operations, partners, and clients. My role spanned digital strategy, UX research, workshop facilitation, UX and UI design, and supporting implementation to ensure the product was delivered with the intended quality.
The product is actively evolving through continuous iterations informed by user feedback and business priorities.
Contribution
Digital Strategy, UX Research, Workshop Facilitation, UX Design, UI Design
Year
2025 – present
Company
Aquablu
Challenge
From operational dashboard to decision-making platform
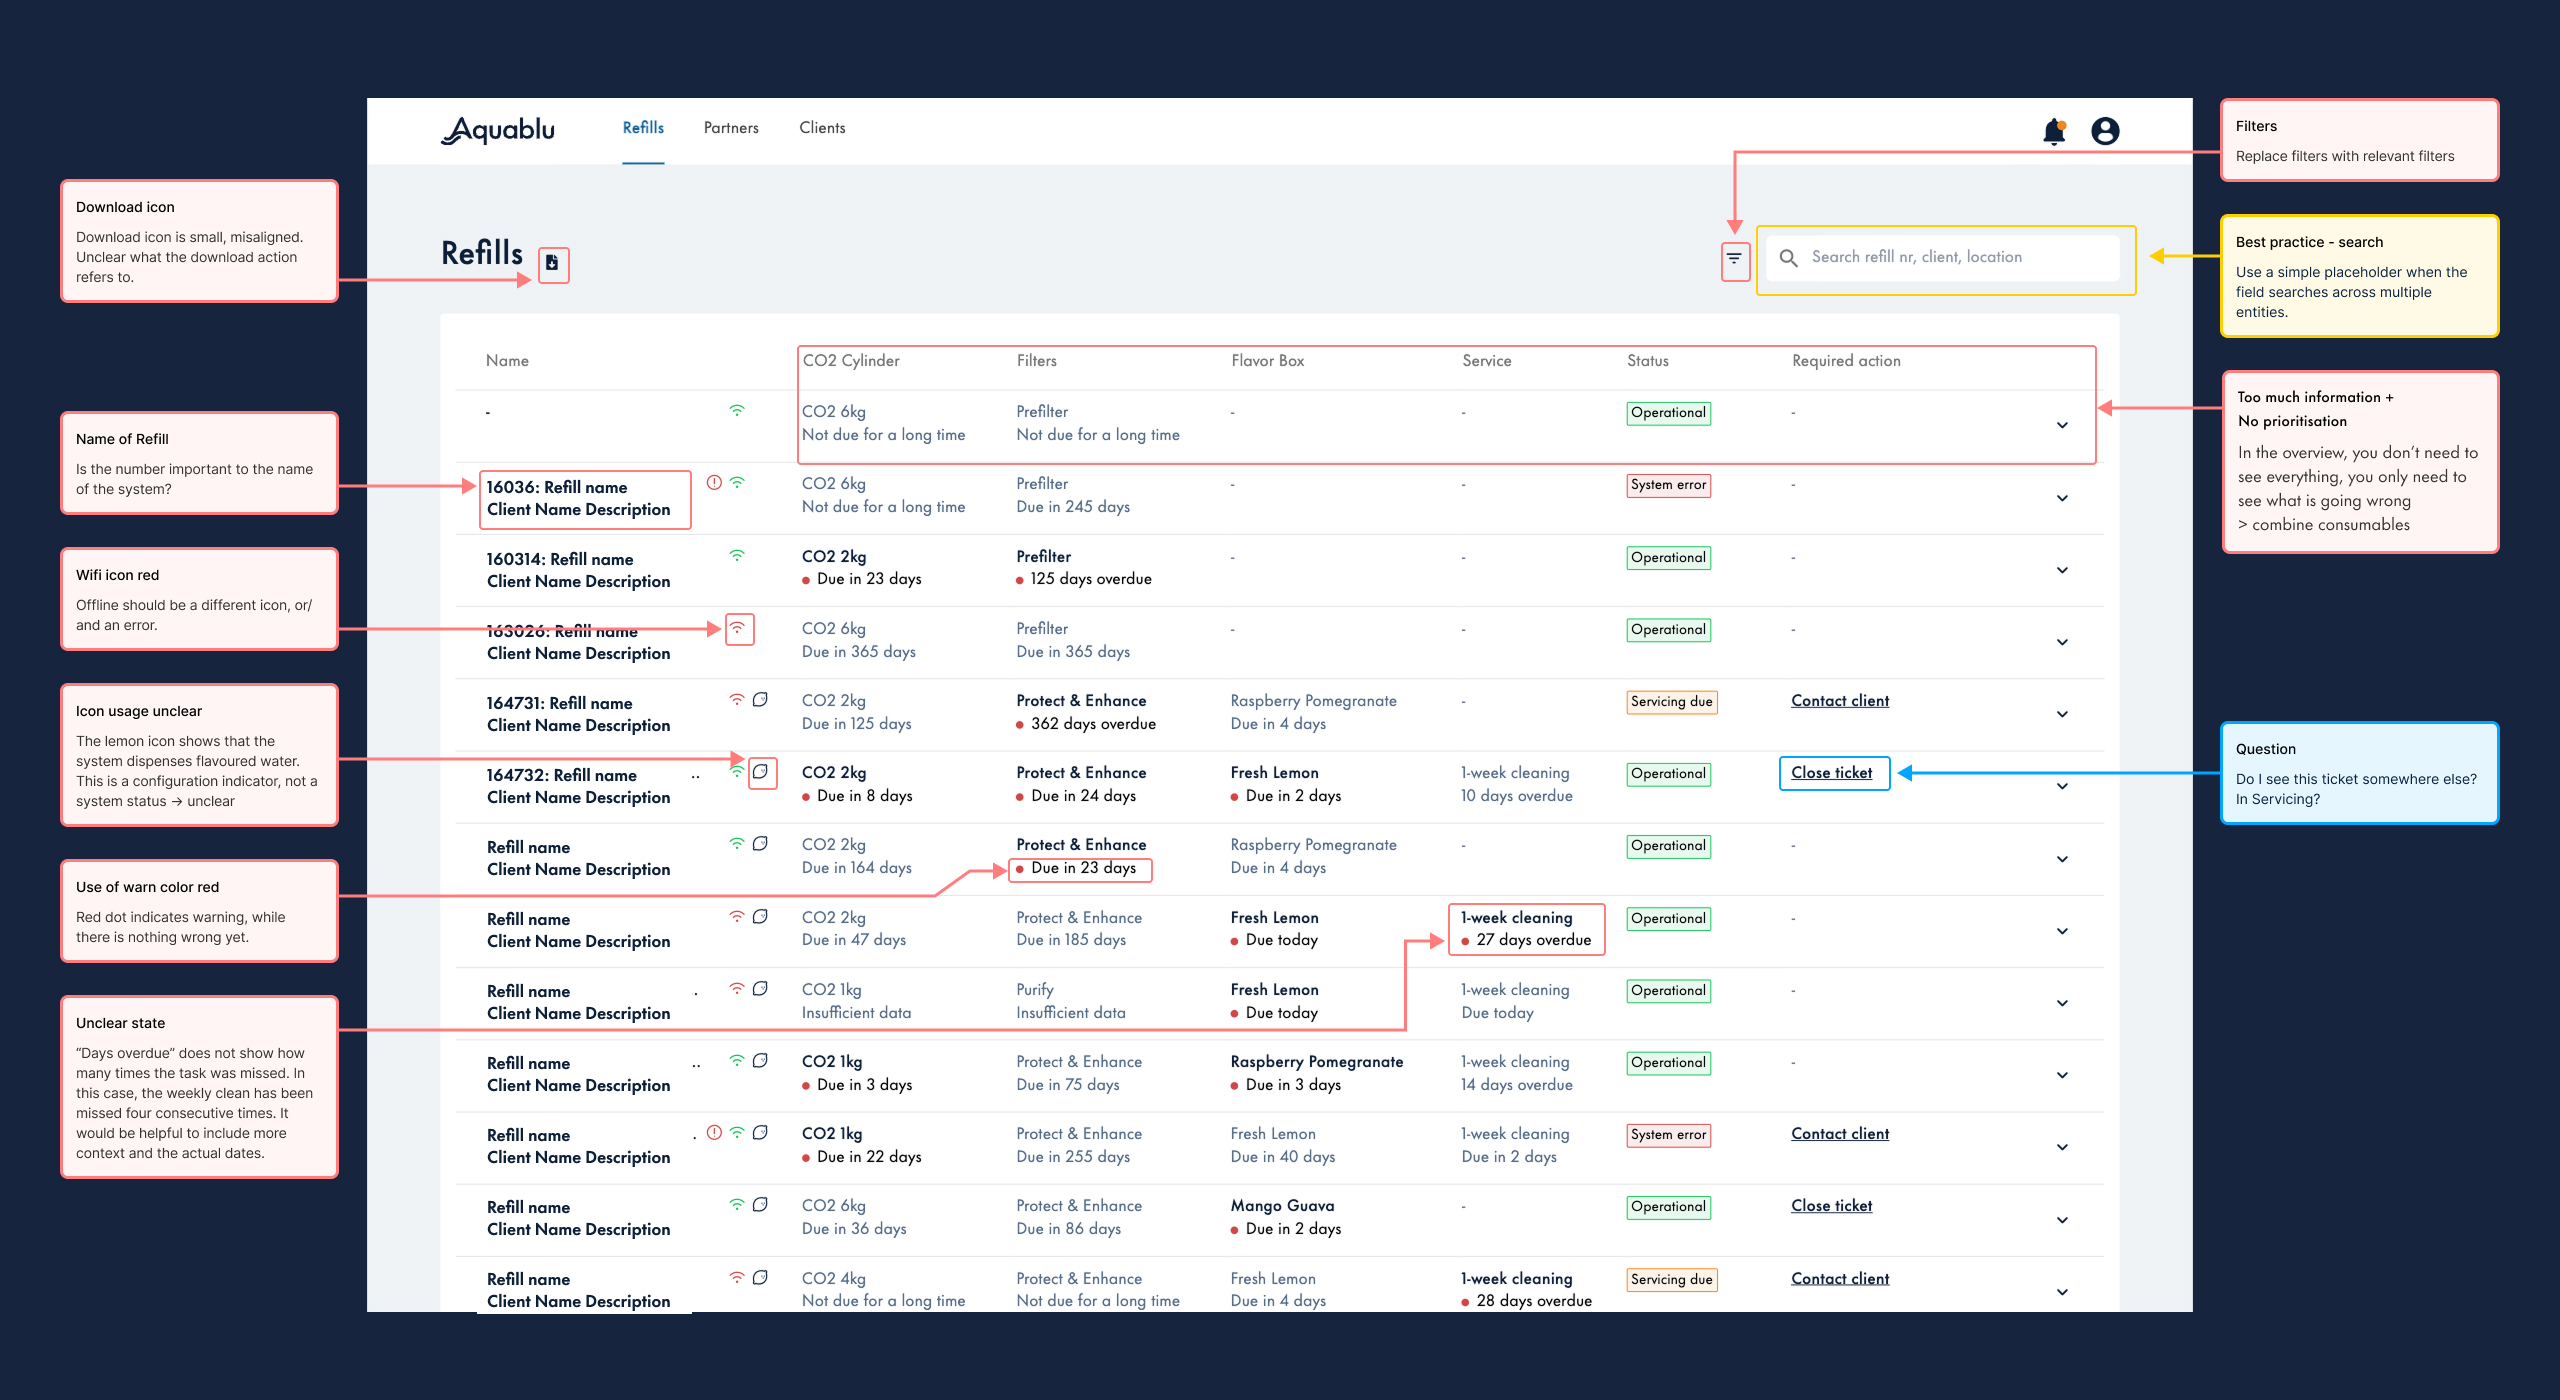
As Aquablu’s fleet expanded, the legacy dashboard no longer supported the people relying on it every day. Service teams struggled to identify what required attention, partners found the platform difficult to navigate, and clients lacked visibility into the health of their systems. What began as an operational tool for a small internal team had become a bottleneck for a growing ecosystem.
These challenges affected more than operational efficiency. Partners increasingly avoided the platform because they couldn’t quickly understand system status, making it harder to provide the level of service Aquablu expected.
The challenge wasn’t simply to redesign the interface. It was to rethink how operational data could help different users understand what mattered, decide what to do next, and confidently take action.
Approach
Discovering user needs
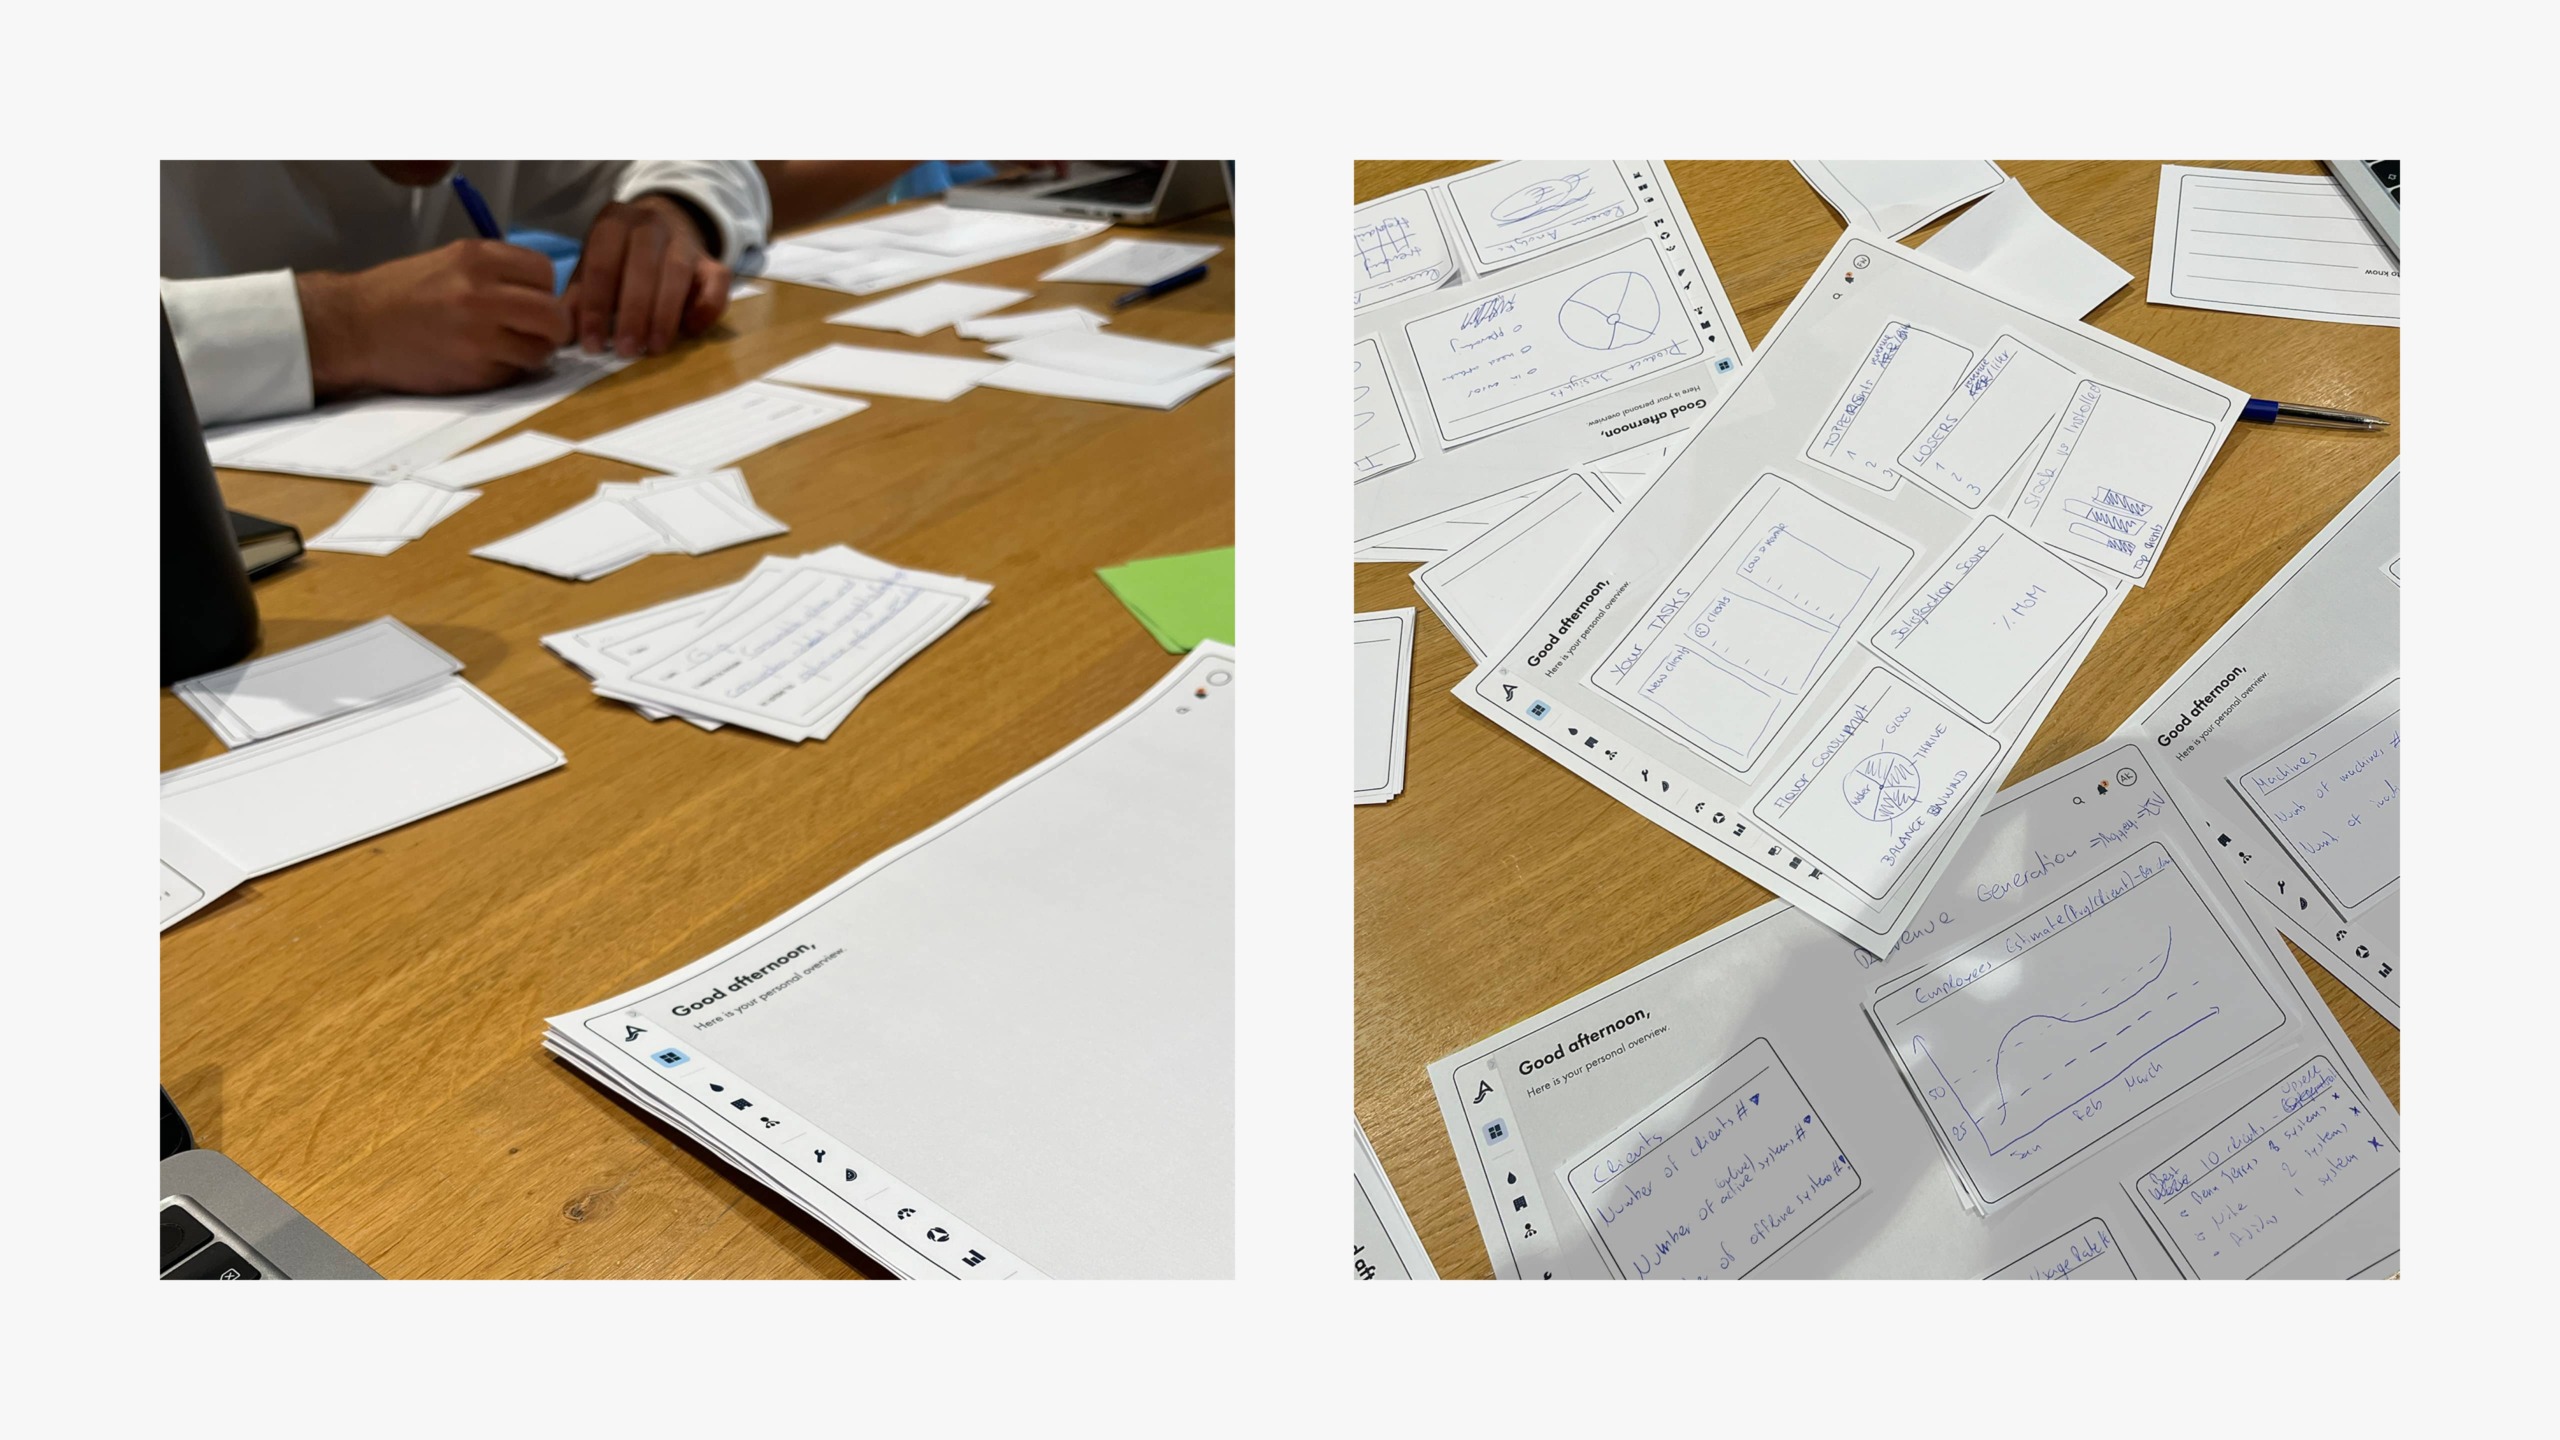
Through stakeholder workshops, user interviews, and workflow mapping, I identified how internal teams, partners, and clients interacted with the platform. Although their goals differed, they shared one frustration: finding relevant information required too much effort, making the dashboard difficult to trust and use.
One insight stood out. Users weren’t struggling with access to data, they were struggling to understand what required their attention. This shifted the design challenge from displaying information to supporting better decisions.
Key Insights
- Urgent issues were difficult to distinguish from background information.
- Navigation reflected the system architecture rather than users’ mental models.
- Operational data lacked context and next steps.
- Different users required different levels of detail within the same platform.
- Fleet-wide insights required manually inspecting individual systems.
- Historical data wasn’t surfaced to reveal trends over time.
Solution
Designing for clarity and action
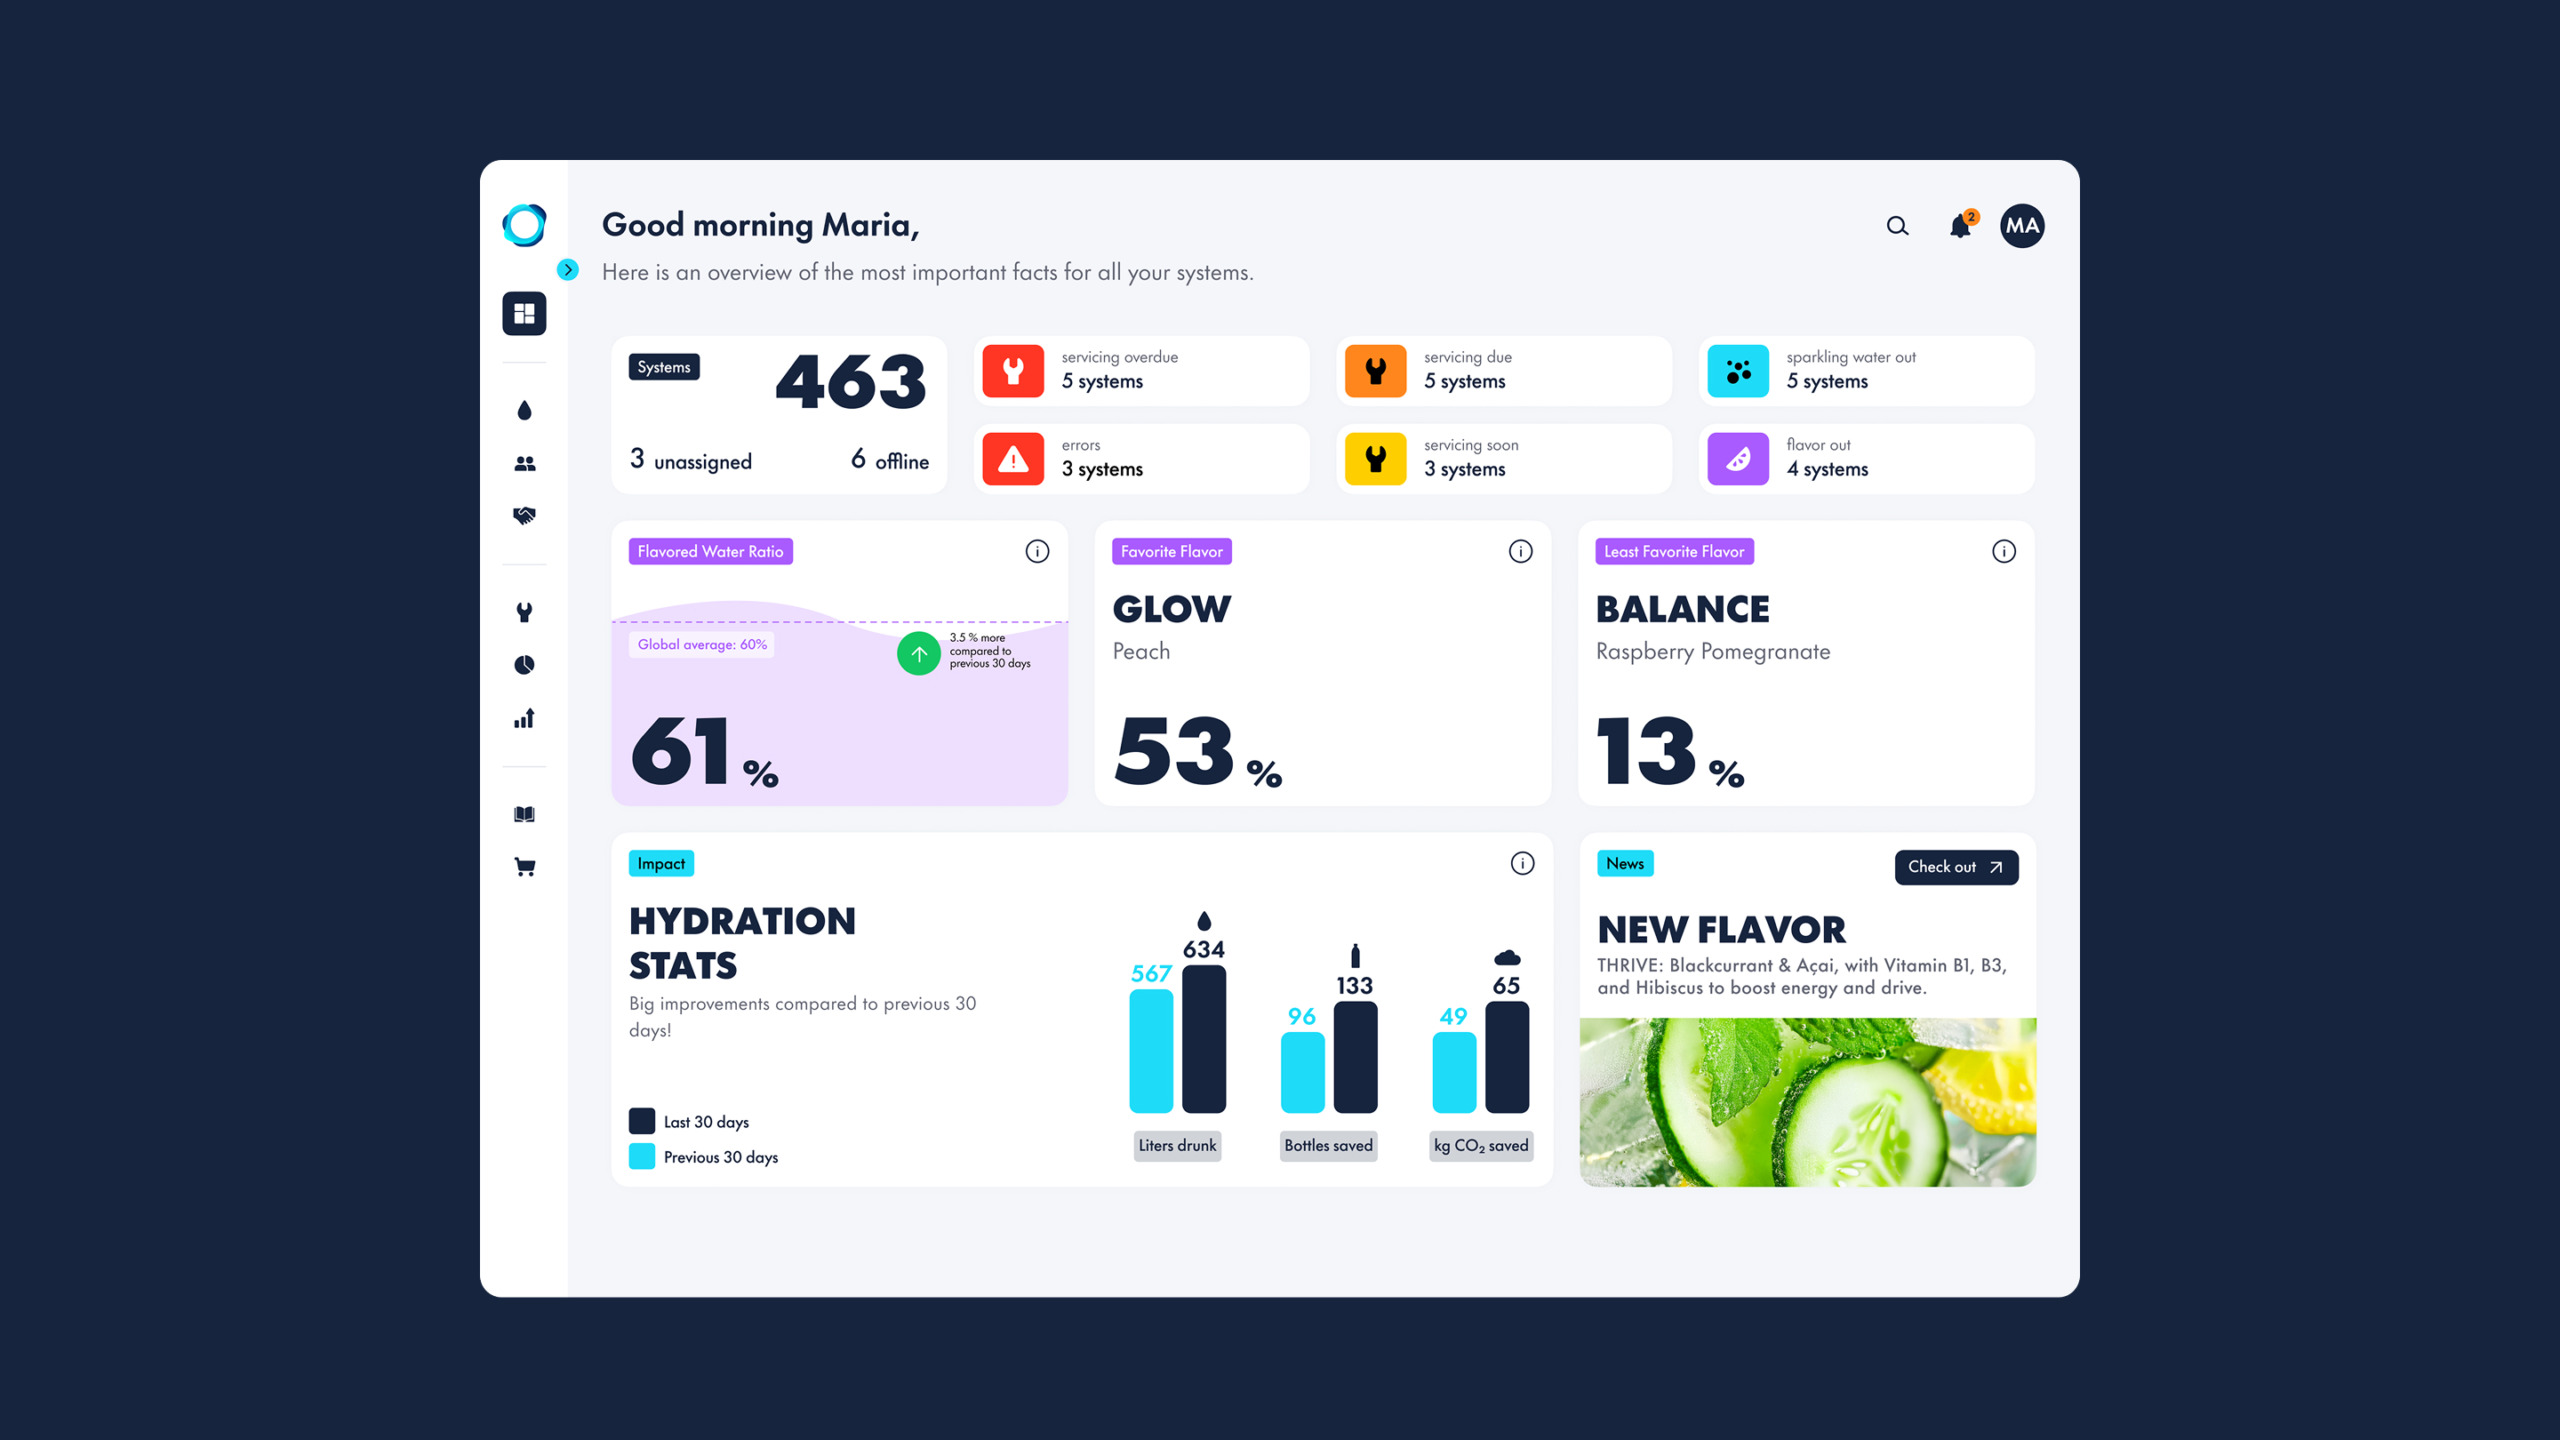
Using these insights, I redesigned the platform around users’ goals instead of Aquablu’s system architecture. Rather than asking users to interpret complex datasets, the interface surfaces the information they need at the moment they need it.
Together with Product and Engineering, I explored different navigation models before introducing a structure that separates operational monitoring, servicing, and business insights while maintaining a coherent experience across user types.
I validated early concepts with users and refined the navigation based on their feedback before moving into implementation.
Information Architecture
From nested information architecture to user goal-driven flow
One of the biggest opportunities was improving the platform’s information architecture. I restructured navigation around the questions users came to answer rather than the underlying technical systems. This reduced cognitive load and created a clearer mental model across the platform.
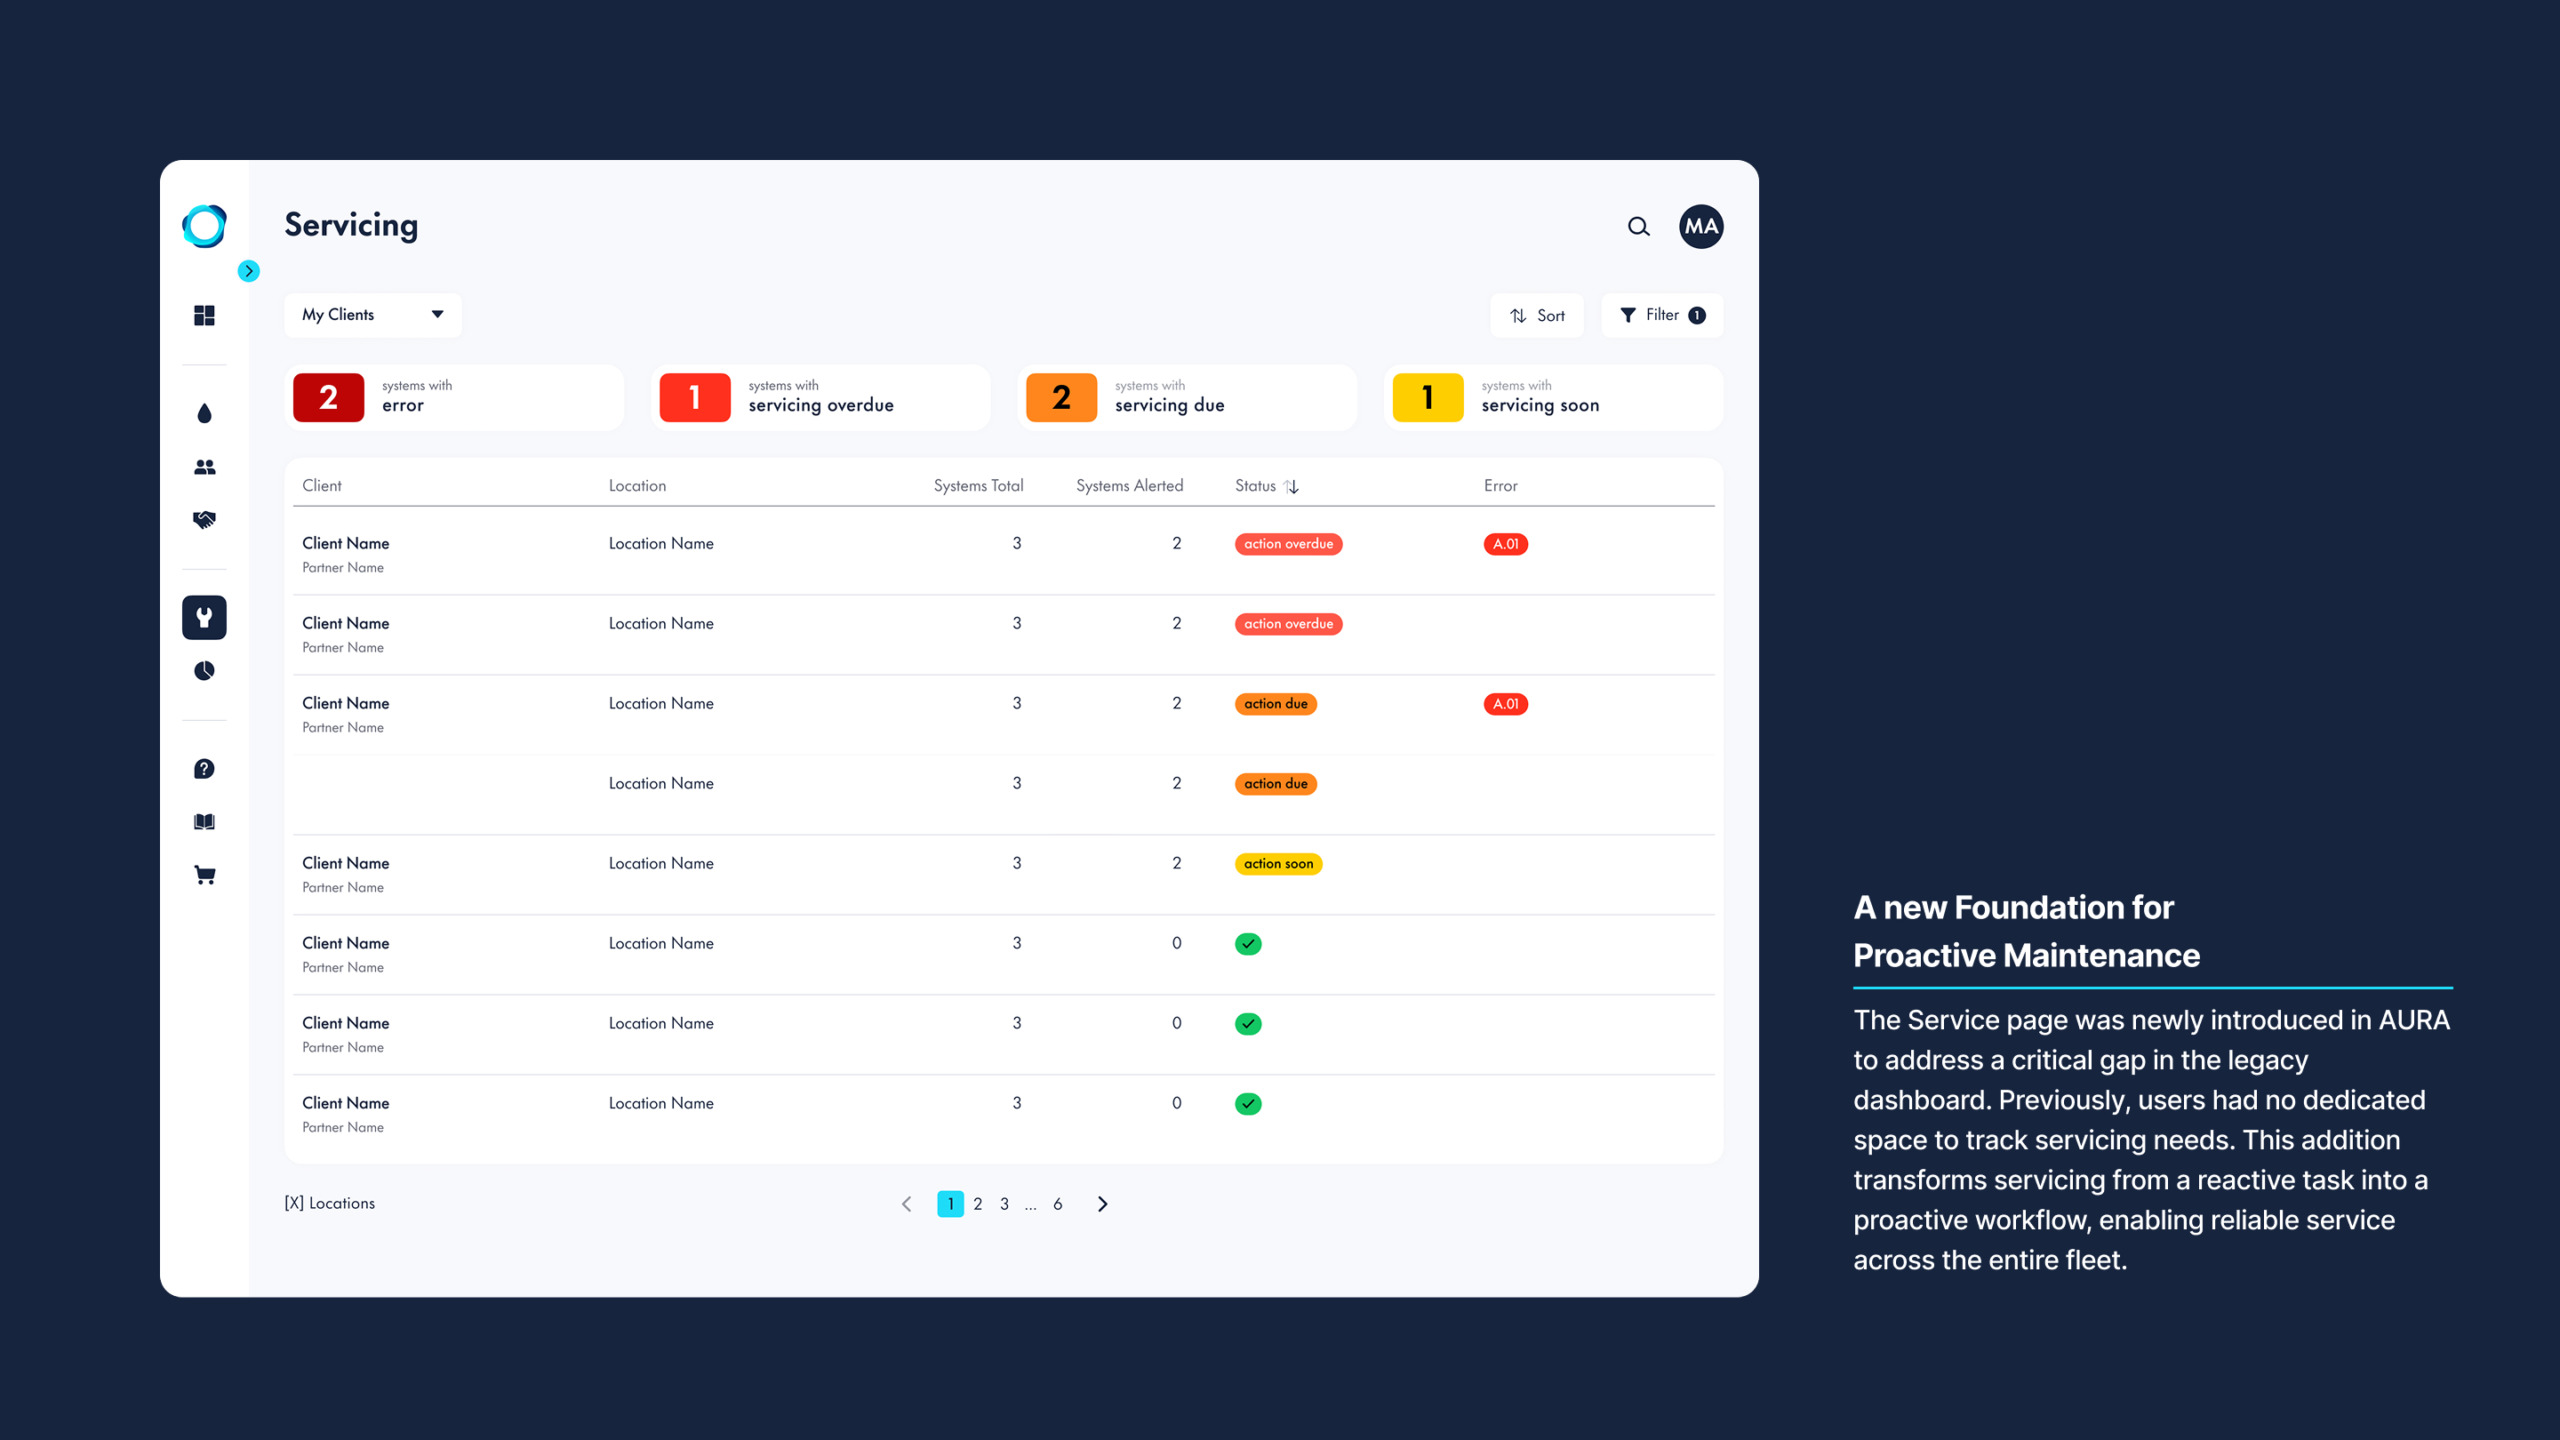
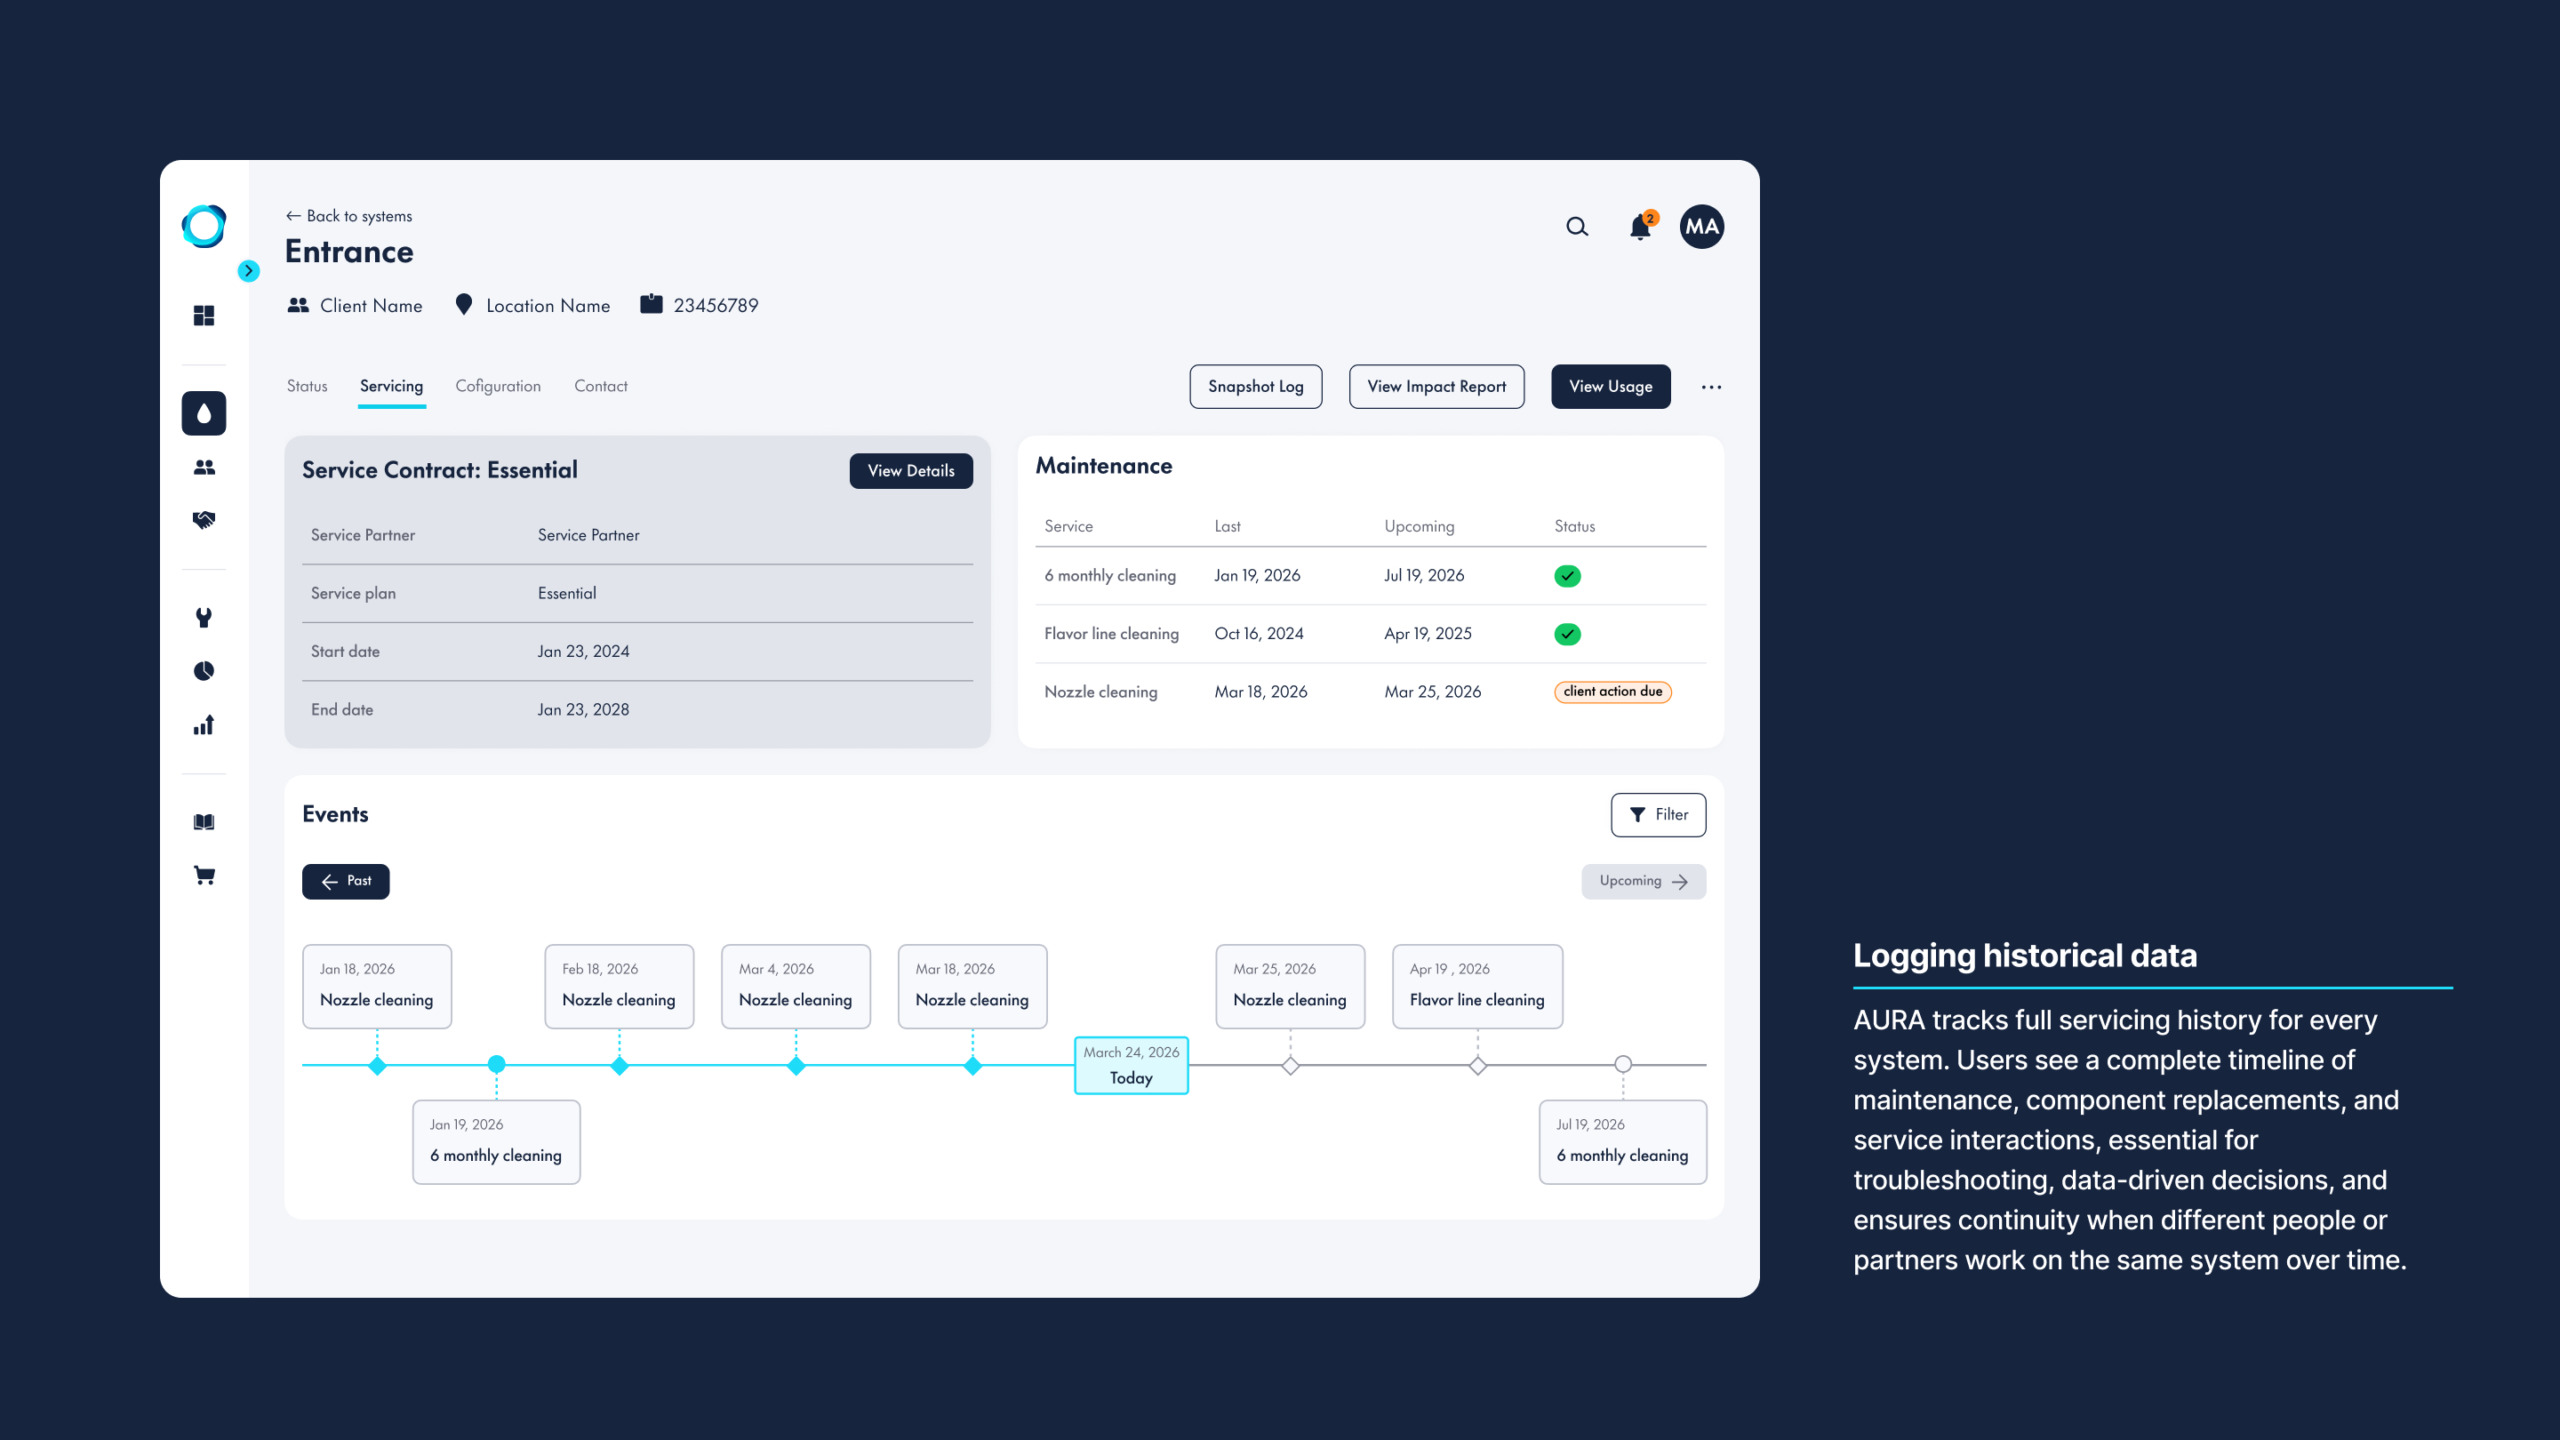
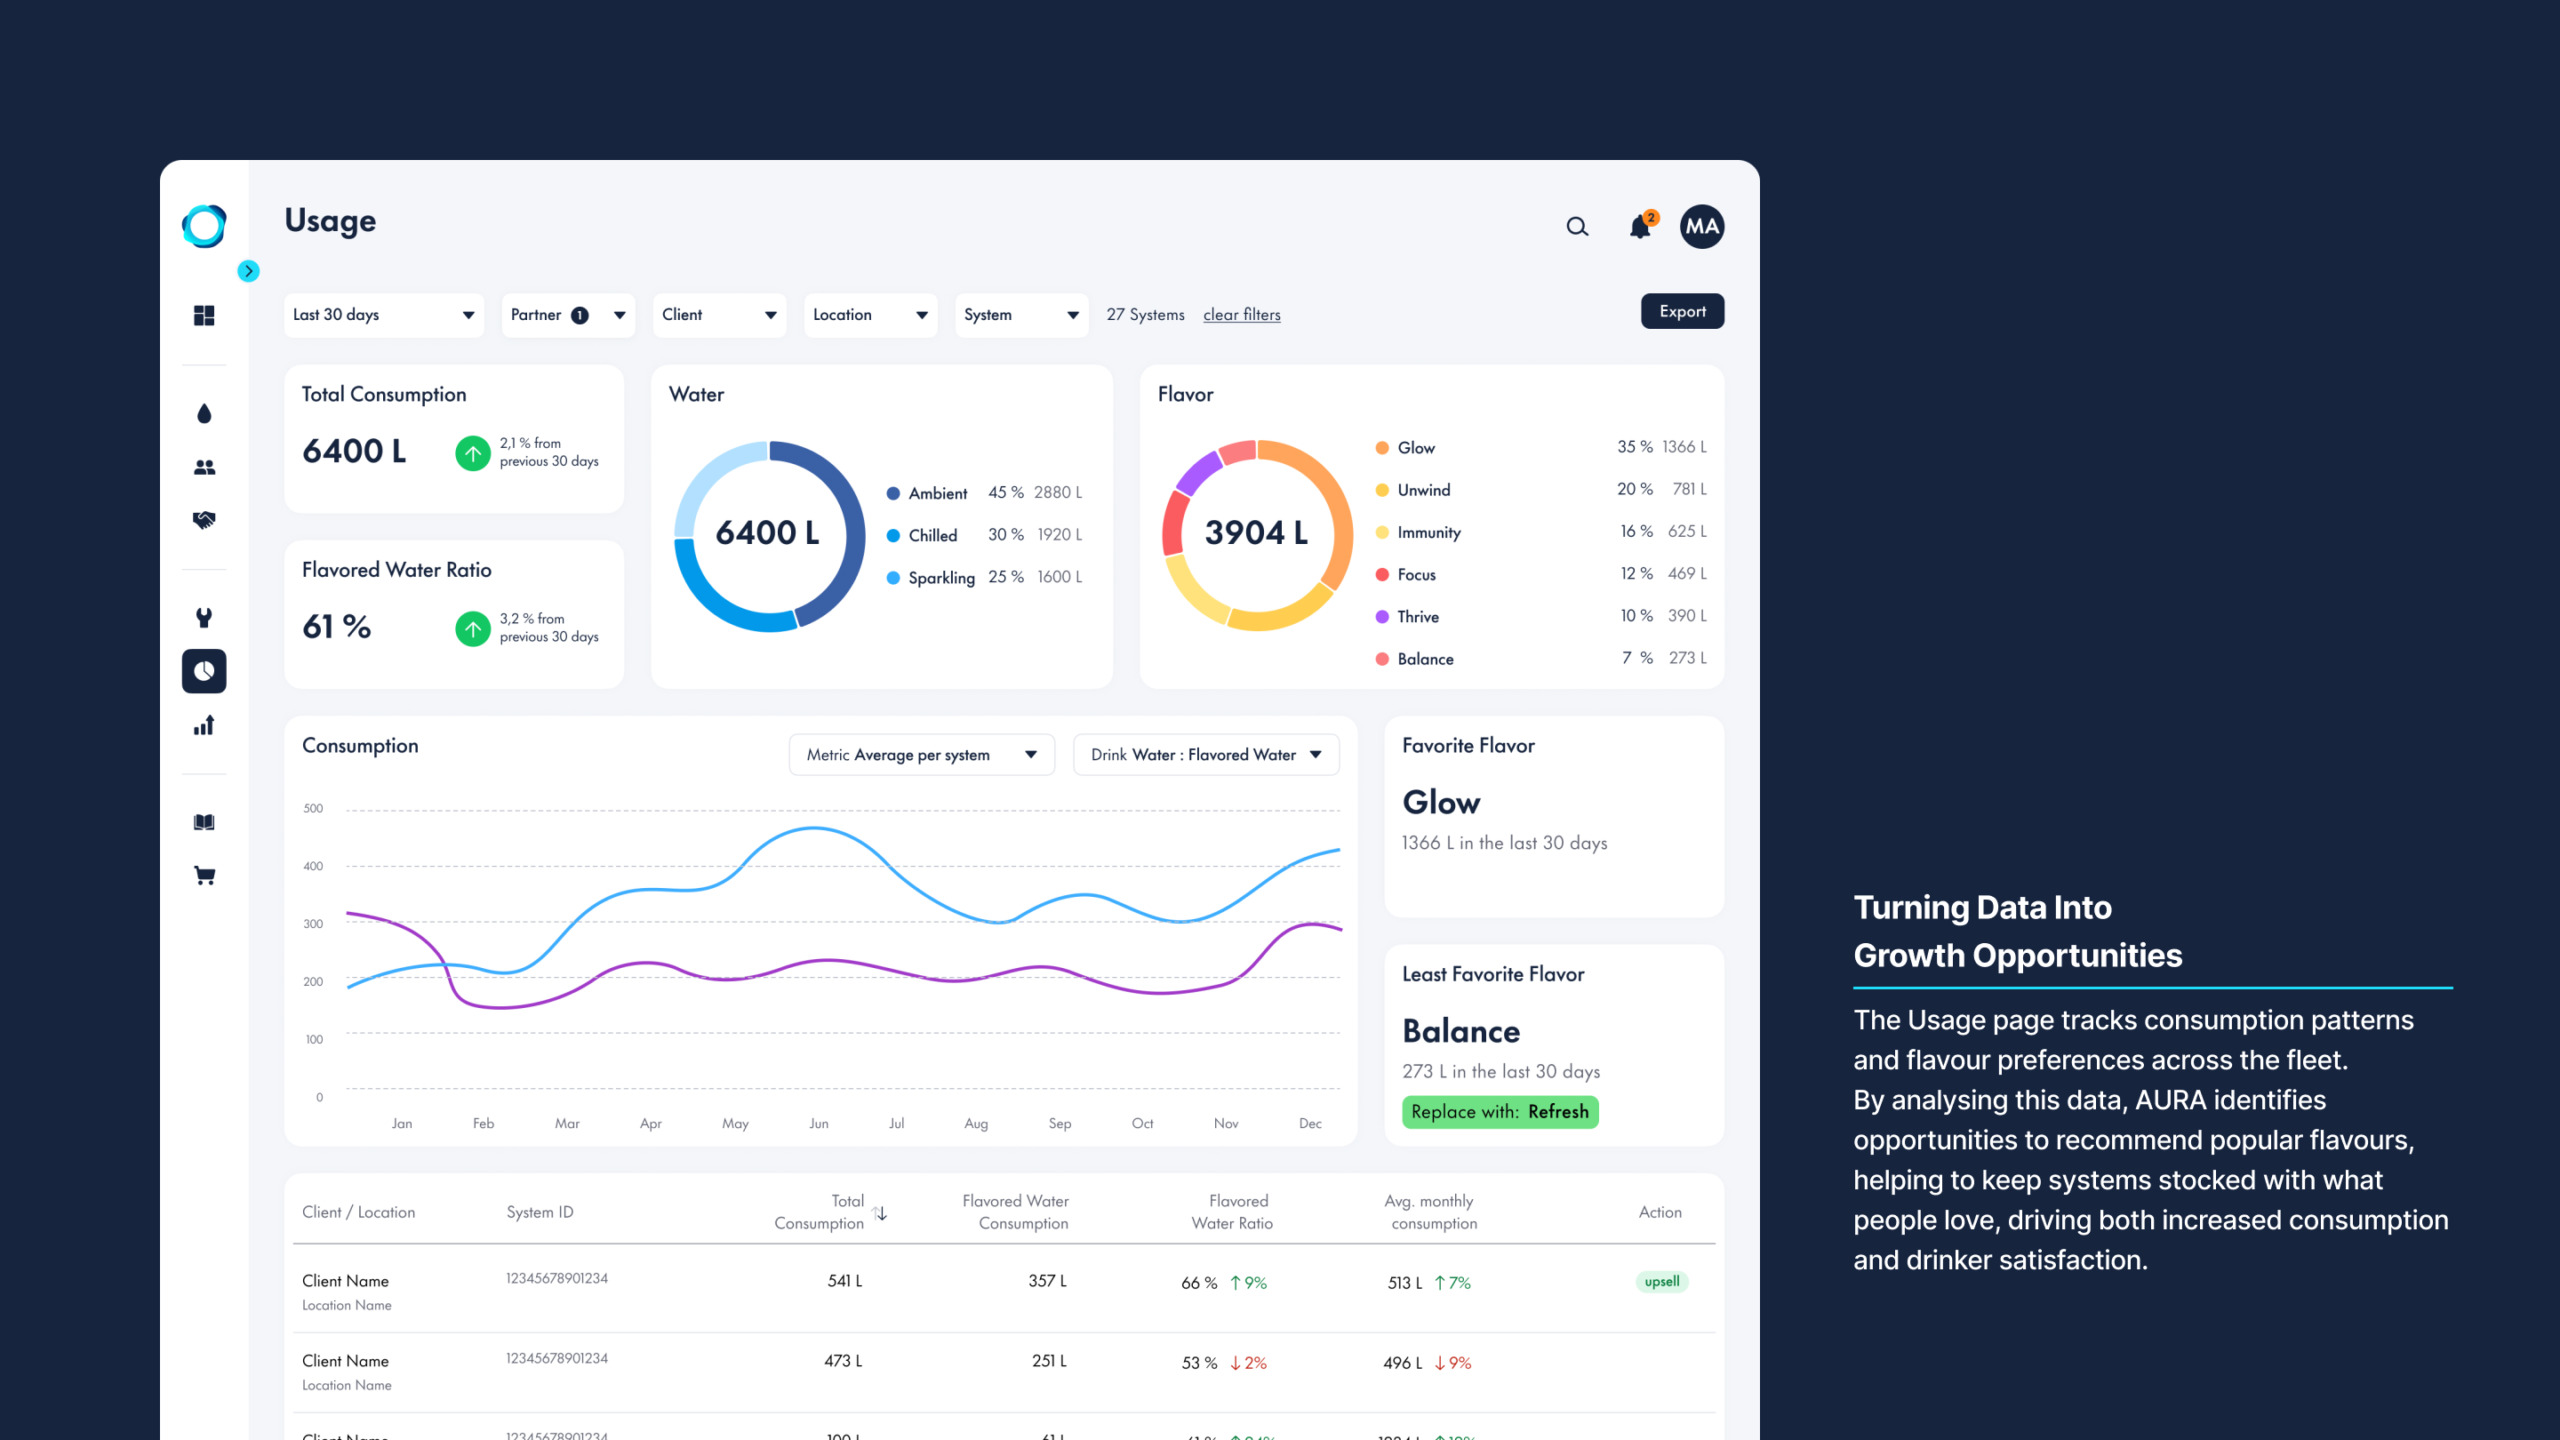
AURA introduced new pages designed to help users quickly find the information they need. The Service page unifies servicing needs and by filtering on urgency users can understand what needs attention, ensuring systems stay in optimal condition. The Usage page tracks performance metrics, enabling Aquablu to improve user satisfaction by recommending flavours users love while driving business growth through increased consumption. This way, we shifted the architecture from being organised around technical system data to being organised around the questions users needed answered.
Design Principles
The right insights at the right moment
Throughout the redesign, I used three principles to evaluate design decisions.
Prioritise attention
Critical information appears before supporting data, helping users quickly understand where intervention is needed.
Progressive disclosure
Complex technical information is revealed only when needed, keeping the interface approachable for less technical users while supporting experts.
Connect operational and business insights
Usage data isn’t presented in isolation, but supports conversations around servicing, replenishment, and customer success.
Impact
The right insights at the right moment
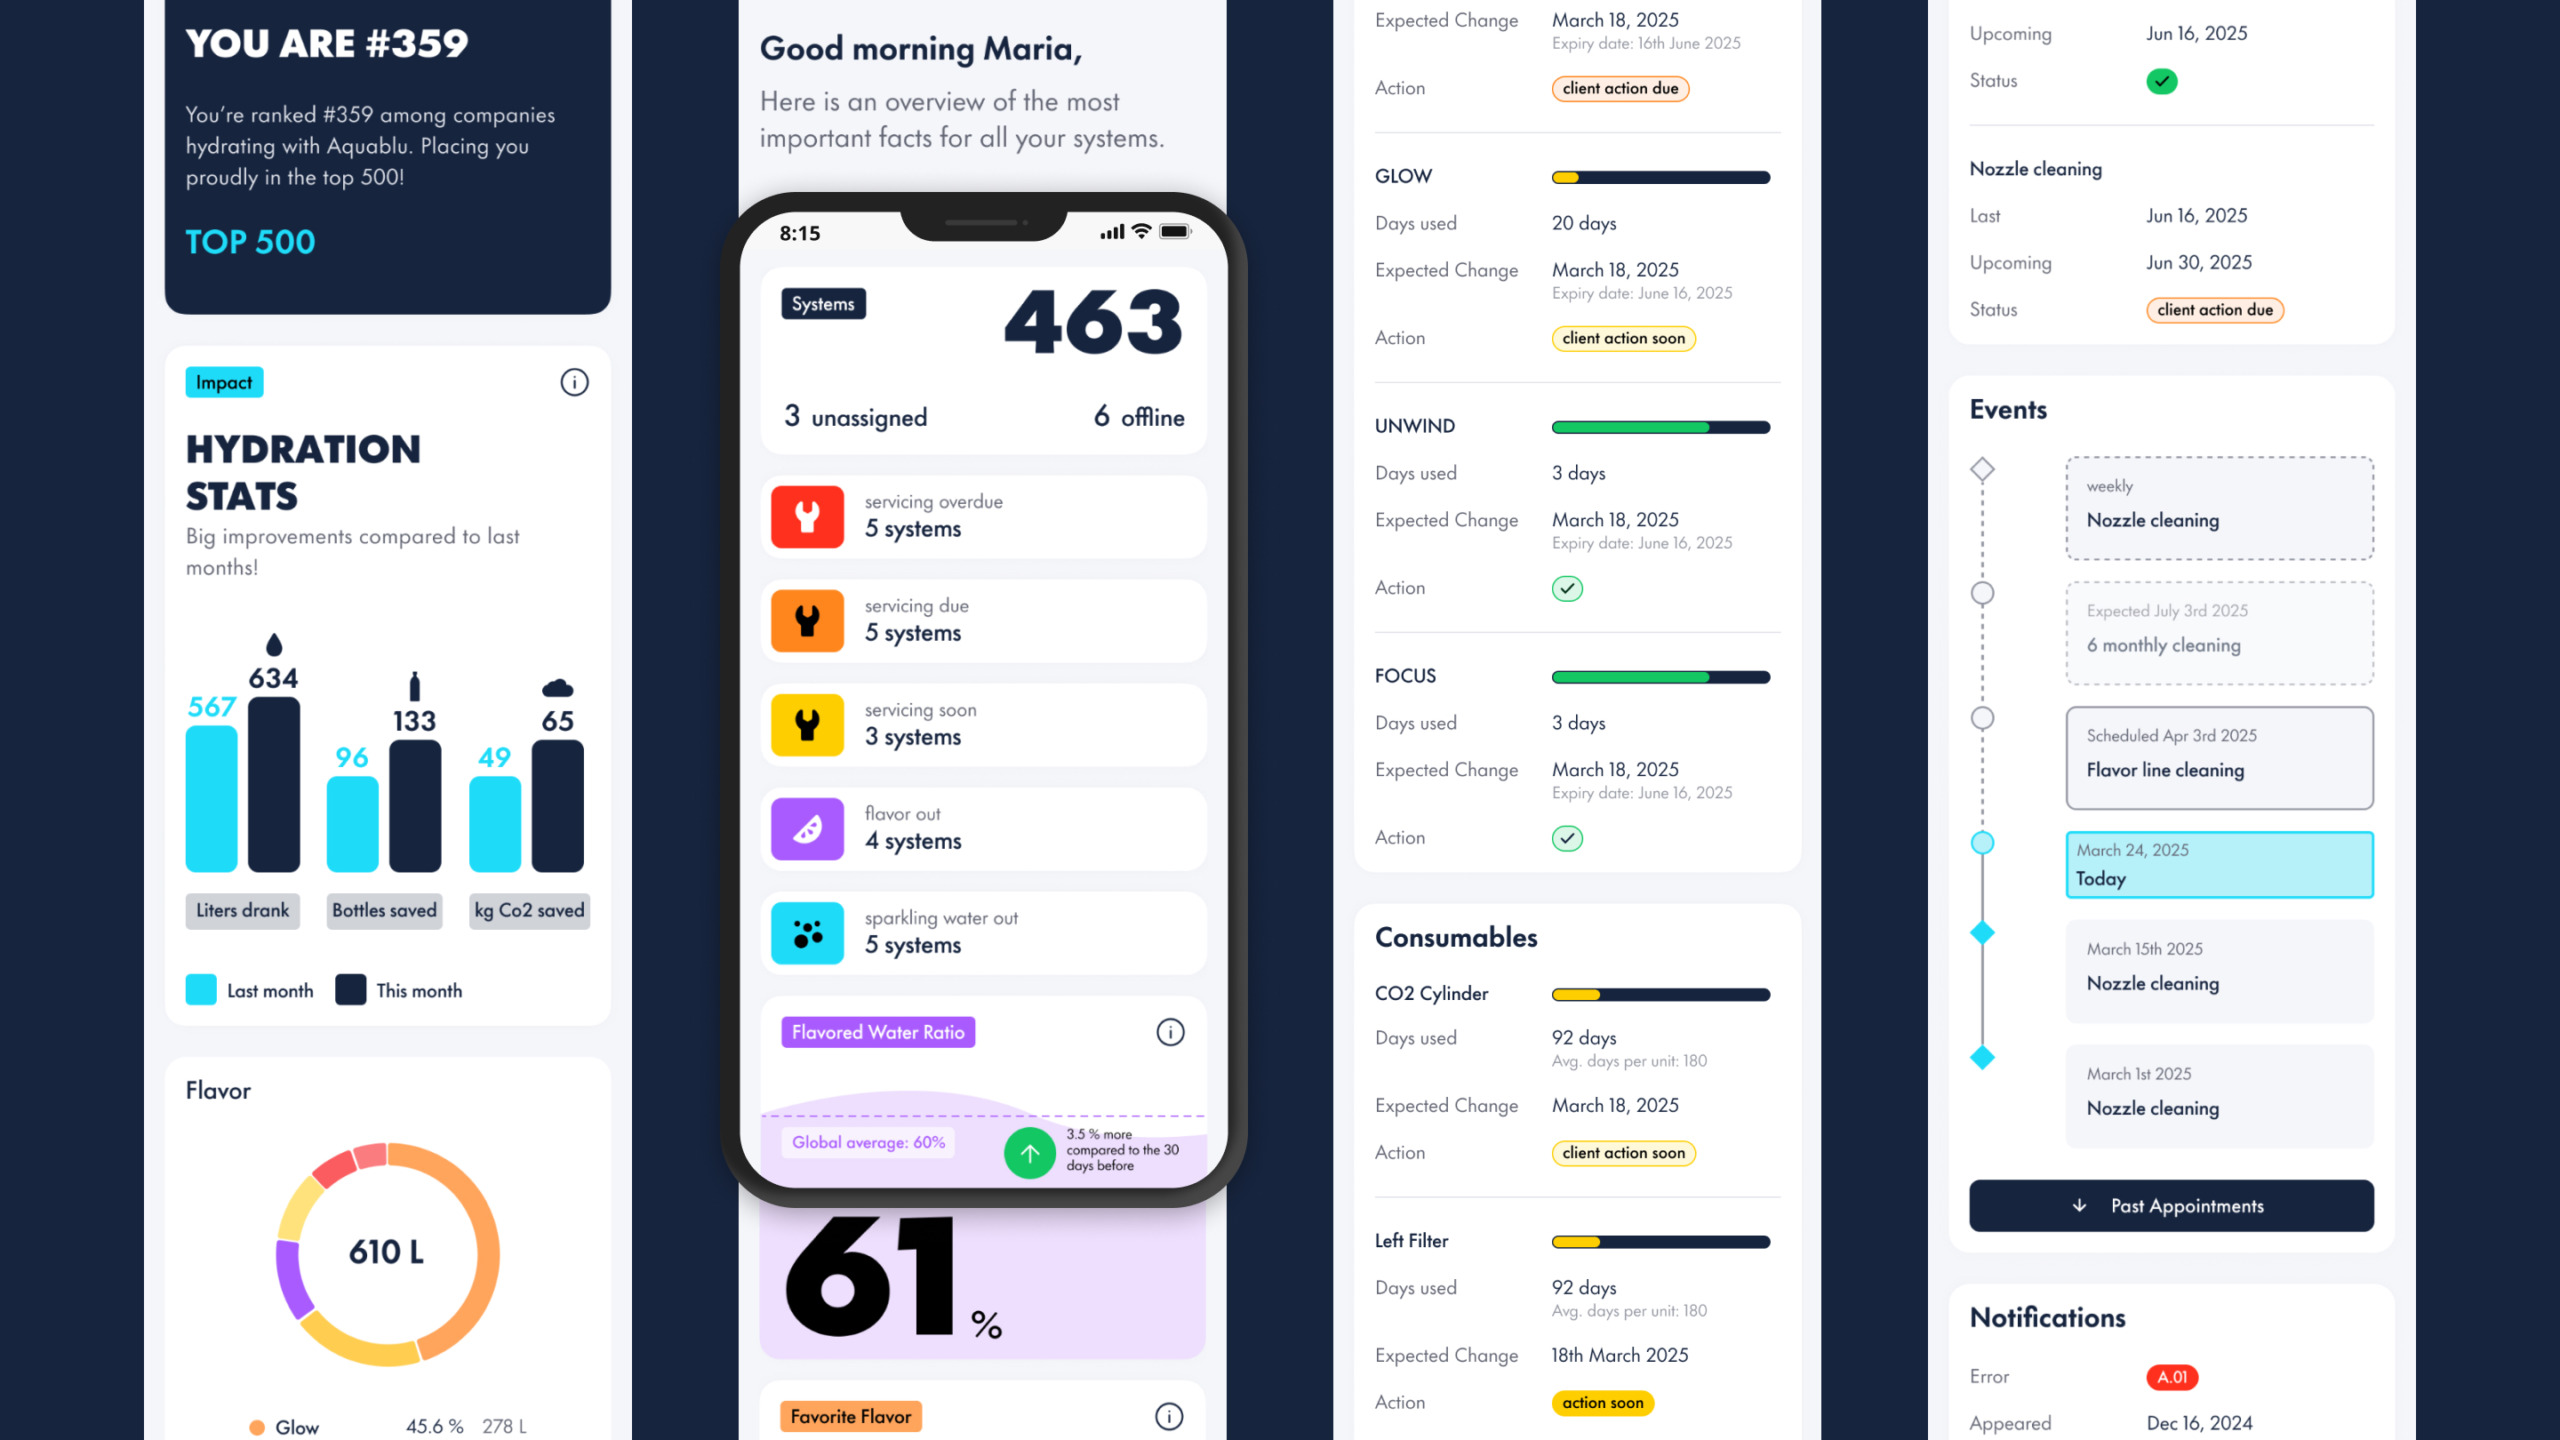
AURA shifts fleet management from reactive troubleshooting to a proactive, value-creating product that brings clarity to operations and supports Aquablu’s growth across internal teams, partners, and clients.
Proactive operations:
Real-time system health and lifecycle visibility enables preventive servicing and fewer disruptions.
Commercial growth:
Usage-based recommendations surface timely reorder and upsell opportunities, improving retention and increasing flavour consumption (business driver)
Partner enablement:
A clearer value story and structured workflows strengthen onboarding and help distributors deliver consistent service.
Client dashboard:
Clients gain real-time visibility into system health and consumption for the first time, so they can stay stocked with popular flavours and contribute proactively.
→ Happier end users, better experience, stronger business results
Reflection
Designing confidence
The biggest challenge wasn’t designing a complex dashboard, it was designing confidence. Different users needed different levels of detail, but they all wanted to know the same thing: What needs my attention right now? Reframing the platform around that question transformed the product from a reporting dashboard into a decision-support tool, and it continues to guide how we prioritise new features and improvements.
2025-2026 | Aquablu